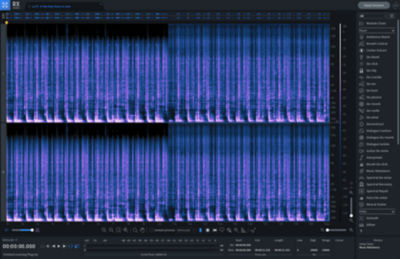
A spectrogram is a graph that shows how the parts of a signal vary with time. It is made by plotting the strength of the signal at different frequencies against time. The spectrogram can be used to identify the components of a signal and their relative strengths. It can also be used to find out how a signal changes over time.
The spectrogram is a valuable tool for scientists and engineers. It can be used to study sound, vibrations, and other types of signals. The spectrogram can help researchers understand how these signals are produced and how they propagate through space.
Spectrograms are used in many fields, including acoustics, seismology, telecommunications, and medicine. They are also used in amateur radio and astronomy.


